
|
|||
| Home | About EBA | Technical Documents | Tools | Case Studies | Contact Us |
|
||||||||||||||||
Sensitivity Analysis to Aid Model Certification: An Example on the Wetland Valuation Assessment Model Applied in Louisiana
Regardless of purpose or type, all models are limited by scientific understanding of the ecosystem being modeled, validity of input parameters, and ability of the model structure to capture relevant processes. Sensitivity analysis is a technique for systematically changing parameters in a model to determine the effects of such changes on model outcomes. It is an essential process for model building and quality assurance. The USACE requires that planning models be coordinated for certification through the Ecosystem Restoration Planning Center of Expertise (ECO-PCX). The purpose of the review is to evaluate the scientific validity and technical quality of tools used for planning, and to ensure the tools conform to policy requirements and are usable. Sensitivity analyses can help address questions raised in the model certification process. Sensitivity Analysis Applied for Ecosystem Restoration To address the comments, the WVA model's sensitivity to adjustments in the above factors was examined to determine if the proposed adjustments would affect the ranking of alternatives for the Barataria Basin Barrier Shoreline restoration project. Because the construct of the models did not lend themselves readily to systematic sensitivity analysis, ERDC scientists reformulated the models in order to provide greater flexibility and utility for analyses. Boundary Conditions In the WVA models, some suitability curves have non-zero y-intercepts, so the value of the habitat for fish and wildlife can never be zero. The reviewers suggested that HSI values should approach zero to indicate that quality is insufficient for the community as a whole for these circumstances. The three WVA models were examined for sensitivity to changes in these intercepts. Two scenarios were specifically evaluated, as shown in the accompanying figure and described as follows: 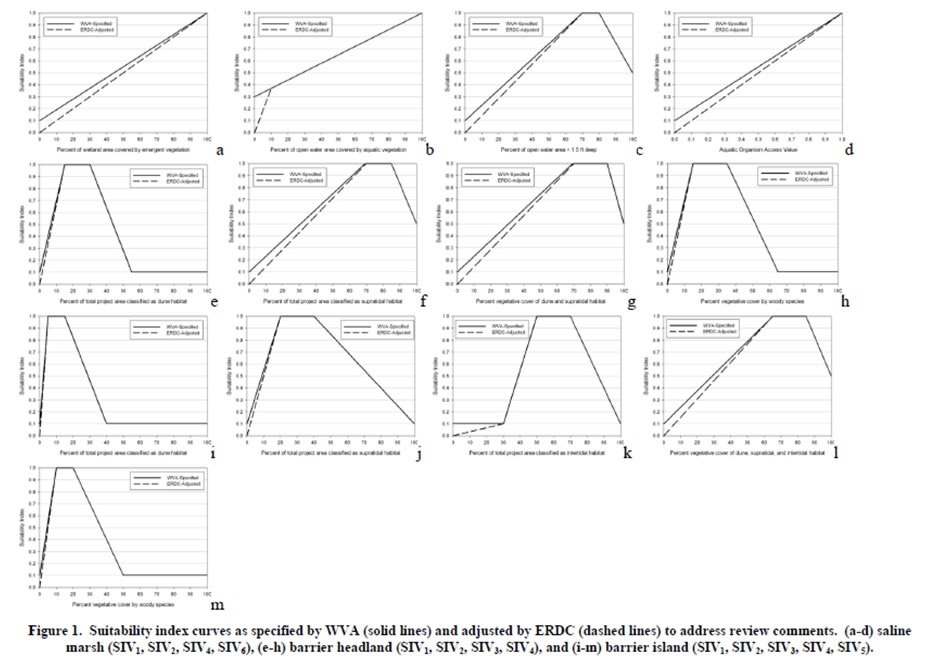 Figure 1. Suitability index curves as specified bu WVA (solid lines) and adjusted by ERDC (dashed lines) to address review comments. (a-d) saline marsh (SIV1, SIV2, SIV4, SIV6), (e-h) barrier headland (SIV1, SIV2, SIV3, SIV4), and (i-m) barrier island (SIV1, SIV2, SIV3, SIV4, SIV5). It is important to note that not all WVA parameters were examined as some were pictorial or categorical in nature and others provided maximum suitability at zero values (i.e., SIV = 1 at parameter = 0). The two intercept sensitivity scenarios that were evaluated as part of the effort reported here were intended to assess model responsiveness to the suggested changes, and in particular determine if those changes affected the outcome of the modeling effort in terms of alternative prioritization. Aggregation Methods The arithmetic, geometric, and harmonic averaging scenarios do not capture the relative importance of model parameters as defined in the WVA algorithm. However, these scenarios provide an indication of the influence of different aggregation algorithms and the sensitivity of the model to these options. Due to complications arising from zero values in these aggregation schemes, an intercept of 10-10 was used to test the influence of a "zero intercept" and also maintain numerical continuity. The motivation behind pursuing different aggregation methods is that geometric and harmonic means will more accurately reflect limiting factors for the HSI curve; thus, this test identified how small a value had to be to become a "limiting factor" which we assumed to be < 0.05. These near-zero intercepts are referred to as the zero-intercept condition. Test Matrix
Results While the absolute value of these changes may be significant, in relative terms they're virtually inconsequential. Of 144 possible rankings of alternatives, only 20 were changed as a result of the eight intercept/aggregation combinations. In no case was the preferred alternative replaced by another alternative as a consequence of these analyses. Again, most of the changes in rankings were associated with the application of the harmonic mean, and the replacement of the WVA-intercept with a zero-intercept. Sensitivity Analysis on Your Project EBA Resources |
||||||||||||||||
|
Updated: July 2024 |
||||||||||||||||